Fortis the Stock is in News.
What charts say about it.
On Monthly charts. Now look at the move from 46( Oct-2008) to 187(March-2010). After that stock retraced 78.6% of its total move and made bottom around 76 in Dec-2011. This move is shown by white lines.
Next move which starts from 76 went all the way to 229(in May-2017), shown by Red lines.

Now 78.6 % of that move from 76 to 229 is around 108 which was tested in last month, shown by green lines. Stock is almost 50% up from that low.
From last 3-4 months stock is trying to get pass the levels of 170 and failing to do so. 168 is 50 % retracment of fall from 229 to 108. 164 is also the 50 month WMA, 169 is also the 89 week SMA.
There is a falling trend line resistance is also around these levels.
So if stock manages to give weekly close above 170, that will give the first sign of correction is over.Final confirmation will come on weekly close above 183.
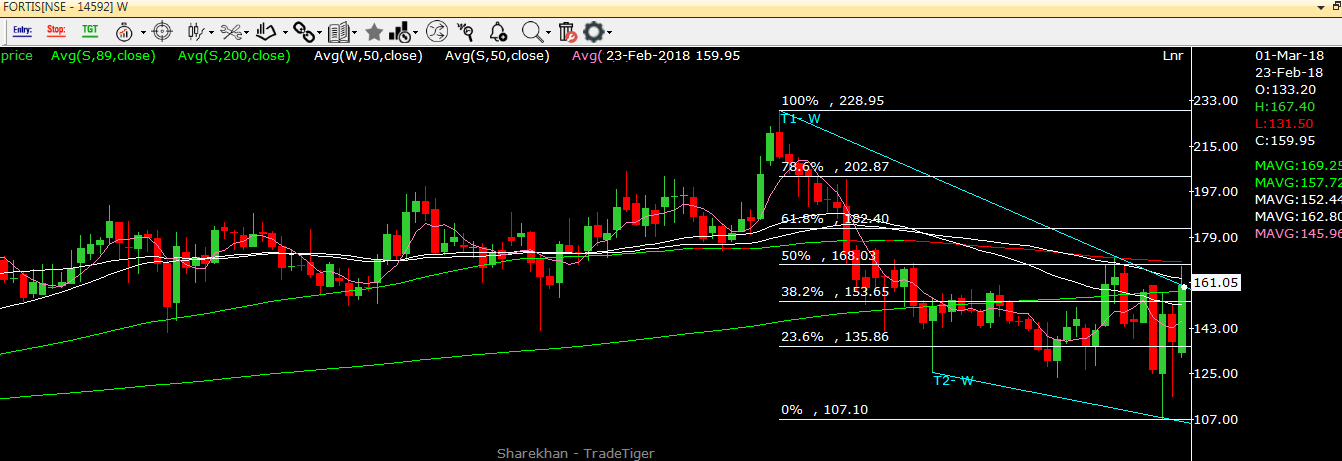
Now coming on daily charts. Stock is just forming an Inverted Head and Shoulder pattern. The break out of that also comes around 162-170. The target of that could be around 210-220 near to the previous high of 229.
138.2% of the move from 229 to 107 is 274.
In short the stock can be bought above weekly close above 170 for targets of 228-270 in next 1-2 years. Around 140-150 lots of big names also entered in this stock. So that area should act as good support.
Disclosure: I am not a SEBI certified analyst so please consult your financial adviser before acting on this call. Further i do not hold the stock as of now, but trade time to time.
What charts say about it.
On Monthly charts. Now look at the move from 46( Oct-2008) to 187(March-2010). After that stock retraced 78.6% of its total move and made bottom around 76 in Dec-2011. This move is shown by white lines.
Next move which starts from 76 went all the way to 229(in May-2017), shown by Red lines.
Now 78.6 % of that move from 76 to 229 is around 108 which was tested in last month, shown by green lines. Stock is almost 50% up from that low.
From last 3-4 months stock is trying to get pass the levels of 170 and failing to do so. 168 is 50 % retracment of fall from 229 to 108. 164 is also the 50 month WMA, 169 is also the 89 week SMA.
There is a falling trend line resistance is also around these levels.
So if stock manages to give weekly close above 170, that will give the first sign of correction is over.Final confirmation will come on weekly close above 183.
Now coming on daily charts. Stock is just forming an Inverted Head and Shoulder pattern. The break out of that also comes around 162-170. The target of that could be around 210-220 near to the previous high of 229.
138.2% of the move from 229 to 107 is 274.
In short the stock can be bought above weekly close above 170 for targets of 228-270 in next 1-2 years. Around 140-150 lots of big names also entered in this stock. So that area should act as good support.
Disclosure: I am not a SEBI certified analyst so please consult your financial adviser before acting on this call. Further i do not hold the stock as of now, but trade time to time.
Comments
Post a Comment