Bank of Baroda
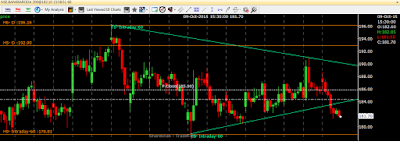
Bank of Baroda broke down on hourly charts from a triangle pattern as shown in charts below. Technical targets for that comes around 165. The stop loss for that trade could be taken as 190.
The stock at the same time is also breaking on daily charts from the same pattern. The technical targets for that are much deeper in the range of 115.
Meanwhile the stock has good support around 145-150 even that will be a 20% move from current levels. These patterns coupled with following news article can see a real down move. This can also drag other PSU banks also with it.
Bank of Baroda finds Rs6k crores of illegal forex transfers
http://timesofindia.indiatimes.com/business/india-business/Bank-of-Baroda-finds-Rs6k-crores-of-illegal-forex-transfers/articleshow/49295338.cms?


Comments
Post a Comment