ACC
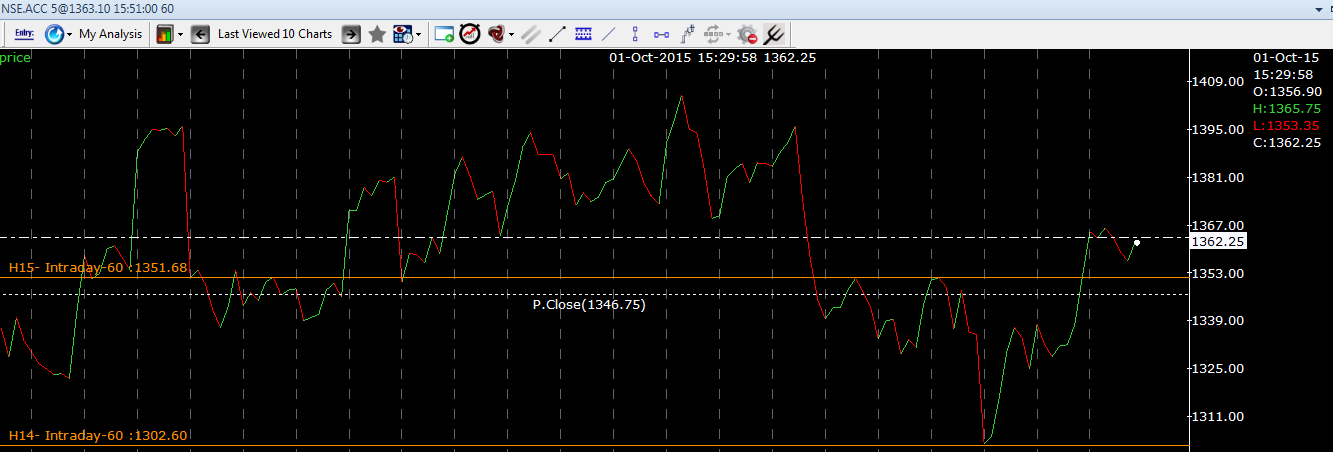
ACC on hourly charts broke out of a bullish head and shoulder pattern. The head of that pattern is around 1302 and neck line is around 1351 so technical target for that is around 1400. The stock already made a high of 1375 on Thursday but closed at 1363 so for short term traders still there is scope for another 30-40 points.
ACC which was earlier recommended to sell on behalf of head and shoulder pattern has achieved its target.
http://marketview123.blogspot.in/2015/07/acc-post-update-acc-recommended-to-sell.html
As already mentioned it has good support around 1355. The stock went below that but now it is coming back. The stock on daily charts is on the verge of break out form a downward slopping channel. If stock can achieve its targets of 1400 for bullish head and shoulder pattern made on hourly charts it will give the break out from that pattern. Technical targets for that break out will be around 1500. Around 1467 there will be a resistance in the form a falling trend line.

The stock on weekly charts is also on the verge of break out in fact it tried to do that last week but failed to do so on closing basis. If stock achieves it head and shoulder pattern target of 1400 it will also break out form that triangle too. Technical targets for that pattern are around 1650 so from 1360 it is a massive upside.
All these bullish patterns on hourly, daily and weekly charts indicate stock is bottoming out and can be a good investment opportunity for medium-to-long term investors.

Disclosure: I am not a technical analyst. I analyze charts for my trading purposes. Further, i am also holding stock in good quantity in cash segment and likely to take F&O position.
Comments
Post a Comment